| Contents: | Main | Chapter | See Also: | Getting Started Manual | Programmer Manual | |||
VA FileMan currently offers three types of statistical processing:
In each case, to generate statistics from reports, you use a two-step process:
The two-step process for each type of statistical output is described below.
NOTE: If you have statistical software on a personal computer, you might want to consider using VA FileMan's Export Tool as an alternative to VA FileMan's statistics options, especially if the statistics options described in this chapter do not provide the statistical analysis you need. With the Export Tool, you can export your data into a format your personal computer statistical software can read and use all of that software's capabilities to perform statistical analyses on VA FileMan data.
The Descriptive Statistics routine creates a summary report of the numeric information produced by the preceding print. The number of cases is always shown.
To get descriptive statistics for fields printed out in a report, you must associate one of the following qualifiers with fields in the print:
| Qualifier | Description |
| # | Count, mean, standard deviation, minimum, and maximum |
| + | Count and mean |
To obtain descriptive statistics:
Initial Print

Generating the Descriptive Statistics
Select OPTION: OTHER OPTIONS
Select OTHER OPTION: STATISTICS
Select STATISTICAL ROUTINE:  DESCRIPTIVE STATISTICS
            User: WILLIAMS,BERNARD        2:51 PM  02/15/96

                              DESCRIPTIVE STATISTICS

         N OF                       STANDARD
         CASES          MEAN        DEVIATION        MINIMUM     MAXIMUM

BUDGET   27       45845.1481       25685.8582      2589.0000    95200.0000
COST     27       45914.1111       25796.2936      259.0000     96000.0000
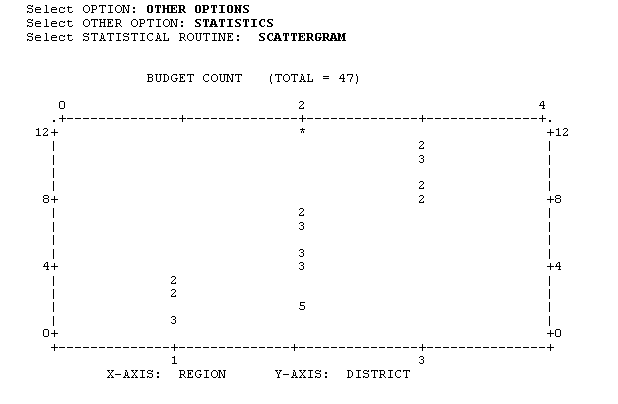
If you subtotal by two fields (i.e., sub-subtotal) in a sort, you can create Scattergrams for fields that were counted with !, +, or # in the corresponding print.
Only numeric values are charted. The Scattergram is scaled to fit your output device's row and column dimensions. Occurrences of more than nine points in a single print position are marked by an asterisk ("*").
Initial Print

Generating the Scattergram

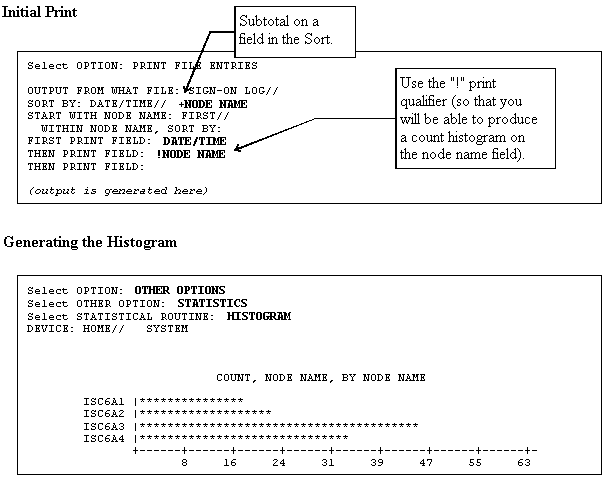
If you subtotal by one or more fields in a sort, you can get Histograms for the fields that are preceded by #, !, &, or + qualifiers in the corresponding print. The Histograms that you can produce depend on which print qualifier is used:
| Qualifier | Description |
| ! | Produces a Count Histogram |
| & | Produces a Sum Histogram |
| + | Produces Count, Sum, and Mean Histograms |
| # | Produces Count, Sum, and Mean Histograms |
Here is an example of a using a subtotal in a print, and then producing a Count Histogram:

Reviewed/Updated: March 4, 2007